


Jackeline A-Z Math Book
by jackelinepucizelo
Copyright © 2017
Jackeline A-Z Math Book

Copyright © 2017
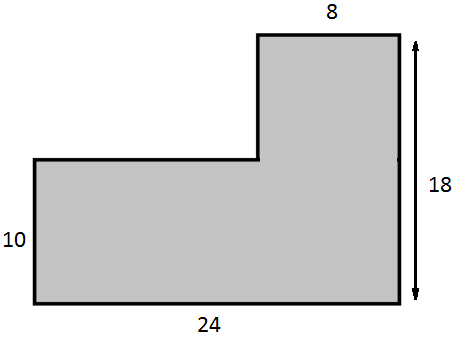
A-Area
It is when you multiply and add a number of the shape.
2
B-Bar Graph
A Bar Graph (also called Bar Chart) is a graphical display of data using bars of different heights.
4
6
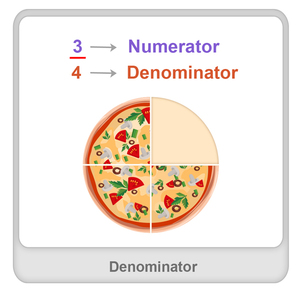
D-Denominator
the number below the line in a common fraction; a divisor.
a figure representing the total population in terms of which statistical values are expressed.
7
E-Equivalent
a person or thing that is equal to or corresponds with another in value, amount, function, meaning, etc.
9
Published: Jun 8, 2017
Latest Revision: Jun 8, 2017
Ourboox Unique Identifier: OB-336555
Copyright © 2017
![]()
 Skip to content